James and the Giant Corn Genetics: Studying the Source Code of Nature

February 9, 2022

The Growth of Plant Science Research In China (2009-2021)

The world changes fast. Once we form perceptions about the way the world is or works, we tend to be a bit too slow to update those perceptions in response to new data.

Last week I posted some analysis of where the scientists who publish in the most selective plant science journals work and live. The short version for those who don’t want to re-read that post:

40% of the papers published in The Plant Cell had a corresponding author based in China, 28% from the European Union plus the United Kingdom, 16% from the United States and 16% from the rest of the world (Japan and Korea are particularly well represented in this last category).

I also said that I was really surprised when I actually read through a year’s worth of issues and counted up the numbers. I would have guessed closer to one quarter of the papers came from scientists in the United States and another quarter from China. There are lots of potential reasons to explain why my gut was wrong, but a big one is that just in the length of my scientific career things have changed a lot and my perception is struggling to catch up with the current facts on the ground.
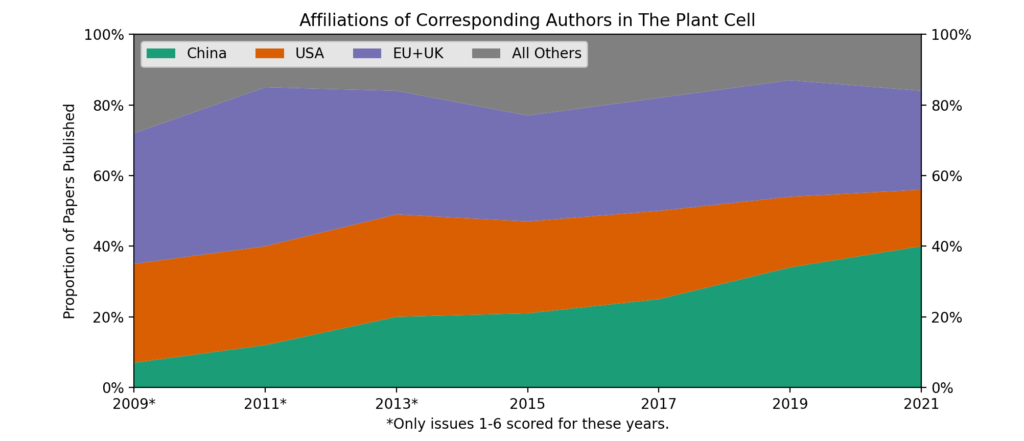
Tracking the changes in authorship of papers at The Plant Cell between 2009 and 2021. Data was only collected from odd numbered years and only from papers listed under the “Research Article” category.

I started graduate school in the fall of 2008. My first full year as a “professional” plant scientist* was 2009. At that time 7% of papers in The Plant Cell were published by authors working in China, 28% by authors working in the USA, 37% by authors working in the EU and 28% by authors working in the rest of the world. In the 12 years since that, China’s share grew to 40%, almost a 6x increase.

So what happened in that 12 year time frame? I don’t have good insight into Chinese policy and funding decisions. But at various points I’ve run into people who have told me that in China, human health research and agricultural research are treated as roughly equal priorities. And China invests a lot in funding plant science, including plenty of dedicated funding for institutes and professors. In the United States plant science is a very small slice of the research our country funds**, and much more of the funding we do have goes out as part of 3-5 year grants for specific projects. Here’s a great visualization of US federal government R&D spending from back when I was a grad student.

Anyway, I’m not sure what the key takeaways are here. I guess 1) It is possible for a country to take big steps forward in scientific discovery and innovation but only if we’re willing to pay for it 2) If you happen to live in the USA, like me, your subconscious may still be assuming that we play a much bigger role in the global plant science research community than we actually do.

The world changes. It is easy to fall behind.

*I was getting paid a bit more than $2,000/month to do plant science. It felt very adult at the time.

**Two big sources of funding for plant science when I started graduate school were the Arabidopsis 2010 project and the Plant Genome Research Program, both run through US National Science Foundation. As you might guess from the name, the Arabidopsis 2010 project ended a decade ago. Plant Genome Research is still around. However, it used to receive dedicated line item funding from congress to conduct research into agriculturally and economically relevant crop plants and the program is now funded at the discretion of the director of NSF.

February 5, 2022

Who Publishes in Competitive Plant Science Journals?

Filed under: Fun With Numbers,Life in Academia — Tags: — James @ 2:50 pm

Where in the world is important plant biological research happening today? It’s a hard question to answer. I could imagine looking at funding, or citation rates, or total papers published in the field. I can also imagine the downsides and potential for bias in all of those metrics. But I’m a strong believer that even imperfect data is better than none at all and I couldn’t find any useful data on this topic.

So let’s start with the easiest of these imperfect datasets to generate: where in the world are the home institutions of the authors of articles published in plant science journals?

I decided to start with The Plant Cell. The Plant Cell is published by the American Society of Plant Biologists, so we might expect it will have a bias towards more American authors and fewer authors from the rest of the world. One the other hand, among journals focused on plant science, and excluding journals that publish solely reviews*, The Plant Cell historically** has had the highest impact factor***, which has tended to attract a global audience of both readers and authors.

I have the breakdown below the fold, but before you look, take a moment to form your own guesses. What proportion of articles do you think came from the United States? From Europe? From China? From the rest of the world combined?

(more…)

January 3, 2022

Predictors of salary among faculty in the same department

Filed under: Campus Life,Fun With Numbers,Life in Academia — James @ 6:59 pm

At most public universities everyone’s salary is a matter of public record. It’s always fascinated me that we don’t talk about this more often. It means it is straightforward to look at the total variance in people’s salaries in the same role and test different ideas for what might explain the differences in compensation between different people in the same role. So let’s take a look!

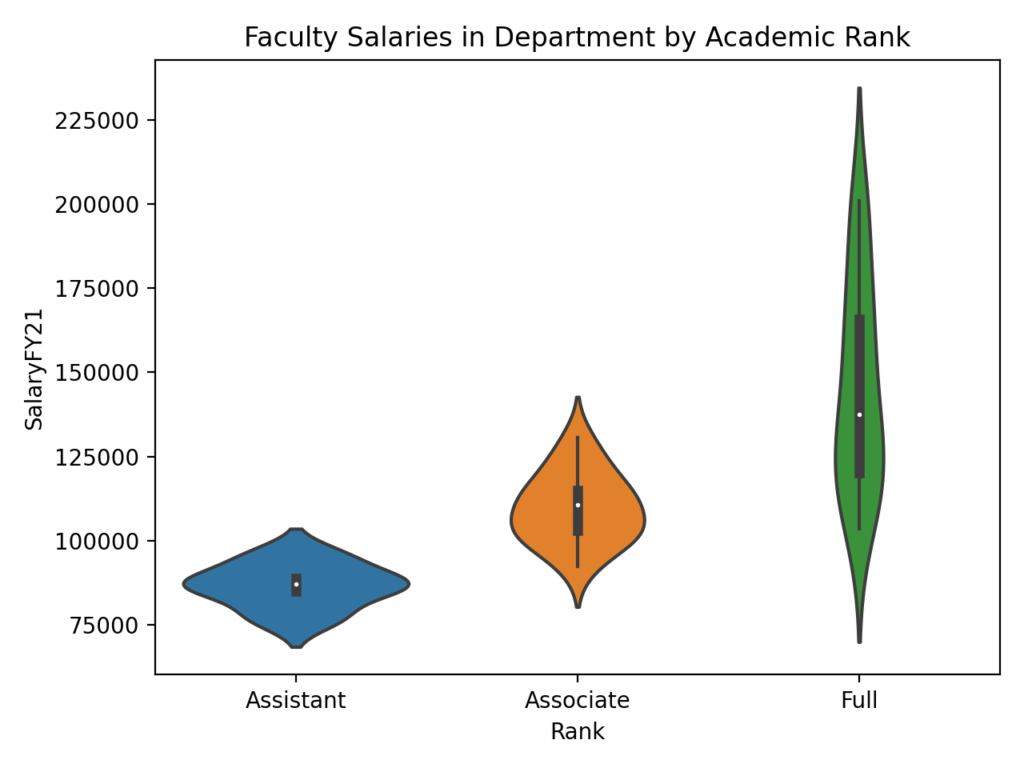
In my own department there are ~45 faculty with research appointments and entries in our school’s 21-22 salary database: Eight assistant professors, fifteen associate professors, and twenty-one full professors. Since assistant professors want to get promoted to associate professor and associate professors want to get promoted to full professors, the simplest model I can think of is to look at how well professor rank predicts salary.

Faculty salaries by academic rank within a single department.
Faculty salaries by academic rank.

Okay, so our extremely naive model is clearly on to something: average salary increases as people get promoted. But also salaries are much more widely distributed amongst full professors than among assistant professors. Lots of things that could be driven by. But what about the classic “let’s boil down research productivity to a single metric”: the h-index? Only 36 of the 45 professors in my department have google scholar profiles. But that’s not the big problem.

(more…)

March 10, 2010

Yield of Arabidopsis

Filed under: Fun With Numbers — Tags: , , — James @ 2:05 pm

Arabidopsis thaliana.

Arabidopsis thaliana is a plant which though its small size, possession of the first sequenced plant genome (released in 2000 four years before the complete human genome), and short generation time* has become a common sight in plant biology labs around the world. From an applied standpoint, the main problem with Arabidopsis research is that, like any model organizism, sometimes biologists discover things that are broadly applicable to the plant world (including important crop species, from apricots to zuccinnis) and sometimes their discoveries turn out to be specific to arabidopsis and some of its close relatives.

Since Arabidopsis is probably now the most studied plant on the planet, could we cut out the middle-man and simply grow fields of arabidopsis? You’re about to become one of the few people who knows the answer to that question. (more…)

February 10, 2010

The top ten instutitions attending the 52nd Maize Meeting this March

Filed under: Fun With Numbers — Tags: — James @ 11:54 am

As determined by the domain names of 402 e-mail addresses that were recently revealed.

  1. Cornell University
  2. Google <– gmail.com was the second most common domain name among these e-mail addresses.
  3. Cold Spring Harbor
  4. University of Guelph
  5. Iowa State University
  6. University of California-Berkeley
  7. University of Florida
  8. UMR de Génétique Végétale du Moulon*
  9. (8) Purdue University*
  10. Syngenta

Overall a total of 134 organizations (or at least domain names) were represented in the list of e-mail addresses of attendees in my possession. If I could dig up historical data it’d be interesting to see how the rankings change over time.

Doing this sort of analysis very quickly (generating the data for this post took ~4 minutes, I timed myself) is one of the fringe benefits of learning even a little about programming.

Official 52nd Maize Meeting website.

(You see what happens when a guy has too much caffeine and then has a chunk of time too short to get any real work done?!)

*These two institutions are tied for number of attendees

January 13, 2010

Even Faster Sequencing

Filed under: Fun With Numbers — Tags: , , , — James @ 12:01 pm

Just five years ago in 2005, the state of the art technology for sequencing genomes was Sanger sequencing, the same basic technology that had been used by biologists for decades, although the sequencers of 2005 were the result of decades of refinement of the basic technique. Five years later in 2010, the newest state of the art sequencer is the HiSeq 2000 from Illumina (at least until the Pacific Biosystems sequencers become available later this year… ::drool::). What difference does 5 years make? It would take more than thirty-thousand of the latest and greatest sanger sequencers from 2005 (right before the first next generation sequencer, a 454 machine built by Roche, was released) to produce as much DNA sequence data as a single one of the new HiSeq 2000s produces.* (more…)

December 29, 2009

Not 2 + 2 = 5, but close

Filed under: Fun With Numbers,Politics,Uncategorized — Tags: , , , , — James @ 12:59 pm

Among the many things Michael Specter talks about in his new book Denialism, is that fact that numeracy (the mathmatical equivalent of literacy) is no longer prized in todays society.

Case in point:

BP, for example, puts $1.3 billion to $1.6 billion a year into alternative energy projects. That’s about 1 percent of the company’s total $20 billion investment this year in future business prospects.*

I was going to beat up on the greenpeace blog where I read this sentence, but on a closer rereading I realized it was actually a direct quote from this article on the New York Times website. Come on people, 1% is easy, all you do is move the decimal place, you don’t even have to divide or multiply. Now there could be some obscure accounting reason that regular math doesn’t apply here, but if so it should have been mentioned and it wasn’t. (more…)

By The Numbers 12/19/09

Filed under: agriculture,Fun With Numbers,Politics — Tags: , , , , , , — James @ 1:22 am
In no way should any of the following statistics be taken as a dig against the people who study wheat. Wheat breeders have done so much with far few resources than have been invested in maize (corn) breeding. Ya’ll are amazing.
  • Year in with the largest wheat harvest in the US: 1981-1982 (2.8 billion bushels)
  • Year in with the largest wheat corn harvest in the US: 2007-2008(13 billion bushels)
  • The US’s share of global wheat exports in 1973-1974: 50%
  • The US’s share of global wheat exports today: 20%
  • Percentage increase in yield per acre of wheat 1969-present: 45%
  • Percentage increase in yield per acre of corn 1969-present: 90%
  • Estimated earliest year a program to develop genetically engineered wheat, launched today, would be able to win regulatory approval for any variety of GM wheat: 2018
  • Year in which Monsanto’s patent on their first generation Round-up Ready Soybeans expires: 2014
  • Number of lawsuits filed by Monsanto against individual farmers it claims infringed on its seed patents in the past decade: 125 (same source as above)
  • Number people threatened with legal action to force a settlement/sued by the RIAA in the same time period: more than 28,000
  • Amount the RIAA sued the russian website allofmp3.com for in 2006: $1.65 trillion
  • The gross domestic product of India in 2008: $1.2 trillion
  • First time the world knew what the far side of the moon looked like: 1959

Check out the article in The Guardian about wheat farming and the future of genetically engineered wheat.

December 10, 2009

More on the Good Guys (CGIAR)

Tracked down a paper published just under a year ago in Food Policy (a peer reviewed journal). “The impact of agricultural research on productivity and poverty in sub-Saharan Africa” by Arega Alene and Ousmane Coulibaly.* 

CGIAR spending on research targeted at agriculture in Sub-Saharan Africa (178 million dollars a year in 2003) provides 1.3 million people with an escape from extreme poverty (living one dollar a day or less) every year. Simple division would indicate the agricultural research of the CGIAR centers is saving human beings from the trap of extreme poverty at a cost of just under 137 dollars per person. Of course it isn’t that simple, there are both economies of scale** and, eventually, diminishing margins of return*** to consider, but it seems the work of the CGIAR centers in Africa are big enough to have achieved those economies of scale, and, given their calculations on the elasticity on poverty to investment in agriculture, Africa is a LONG way from having to worry about diminishing marginal returns on agricultural investment.

Given the elasticity of poverty reduction to agricultural research spending they calculate (-.22) the marginal cost* of reducing poverty by another person in Sub-Saharan Africa through investments in agricultural research is only $71. (i.e. spending one billion dollars more on agricultural research would save an additional 14 million people from poverty.) This doesn’t consider the additional postive effects of improving local agriculture (for example reducing the incidence of famine).

Finally consider this quote from the paper for a sense of the work the CGIAR centers are funding and try not to feel as impressed as I do: (more…)

December 4, 2009

Quick Question On Student Debt

Filed under: Fun With Numbers — Tags: — James @ 12:49 pm

Numbers in this post come from from The Project on Student Debt. I can’t vouch for their accuracy myself, but assuming they are:

Which of these numbers do you think is more informative?

  1. Among college students in Iowa graduating with debt, the average amount owed was $28,174 (73% of students graduated with debt)
  2. Among all college students who graduated in Iowa last year, the average student owed $20,567? (more…)
Older Posts »

Powered by WordPress