For anyone who was interested by the map I posted a while ago comparing the electoral strength of Hillary Clinton and Barack Obama vs John McCain, the site where I pulled my raw data from is now doing the same sort of comparison, with updated numbers, and only looking at states that aren’t safely Democratic or Republican, regardless of the nominees. I am satisfied in the fact that I had a map up before a site with 25,000 page views started doing the same thing.
April 9, 2008
March 28, 2008
General Election Strength
If anyone is following the race for the democratic nomination for president, one topic that gets discussed ad nauseum is whether Barack Obama or Hillary Clinton has a better chance of winning against McCain in the fall. The problem with such arguments is that there are different roads to victory and and the two candidates are strong in different parts of the country and weak in different parts of the country.
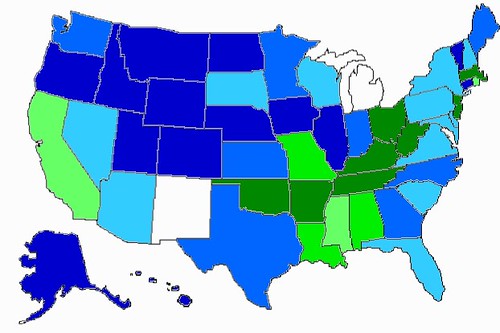
In order to better visualize this I’ve dusted off my knowledge of Perl to generate a map of the states in which each candidate has an advantage. Dark blue states are ones where Obama does ≥ 10% better than Clinton relative to McCain, medium blue are ones where he does ≥ 5%, and light blue ones are where his advantage is 1-5%. States where Clinton has a relative advantage are marked in green, and coded using the same dark ≥ 10%, medium ≥ 5%, light 1-5% system.*
*All calculations based on the most recent poll in each state, and using date pulled from a site I highly recommend Electoral Vote.
Things to keep in mind:
1. A relative advantage doesn’t equal a win. (For example Obama is 27% closer to McCain in Utah than Clinton is, but that still means polls show McCain winning 50%-39%)
2. Likewise a relative disadvantage doesn’t equal a loss. (Clinton has a 12% advantage in Massachusetts, Obama an 18% advantage in Illinois, but the democratic nominee would certainly carry both states.)
3. The margin of error on most polls in 3-5% so the lightest blue and lightest green states are ones where neither candidate has a significant advantage. If I did this map again in a week, after new polls had come out, a lot of those states might change colors.